Google analytics is an awesome program that will give you insights into your website that you never could have imagined. Things like:
- Demographics on who visits your page.
- Insights on how long people stay on the page.
- Where people land on and go to once they are on your site.
- Real time reports on who is visiting your site, from where and which device they are using (mobile/computer).
- Editing options available to record changes you make on your site and how it affects profits and behavior.
- And a plethora of other amazing tools…
And all of these insights come with their own numbers, graphs and info that quite frankly can be quite intimidating and confusing if you’re a beginner to the program.
I will personally admit that I do not know EVERYTHING there is to know about Google analytics, but I know more than enough information to understand the numbers, make the right adjustments based on it and to truly utilize this program as it is meant to be used.
While I will not cover every single little detail I know about this program, I will give you an overall idea of what to do with the info you get from this program and how to apply it. Understand that in order to really start comprehending the information from this program, you have to take every single piece of info I will give you here slowly and examine/comprehend the info one step at a time.
So do not try and comprehend this entire tutorial all at once, instead just read every section of it and re-read it if you have to. Do not move into the next part without understanding the previous one/s.
So before we begin, do you even have Google analytics installed? If not…
There’s numerous ways to do it and it’s free. Here is a tutorial. My preference is doing it on a WordPress website since this platform offers easy installation options for this program. Also added to that, it is also the most popular website installation platform to date.
For other platforms, you will need to look it up on Google or YouTube, but rest assured, you will find installation options of this program no matter what type of website platform you use 🙂
Anyway, here is how to understand Google analytics:
The goal of Google analytics is to give you insights on how many people visit your website and how they behave on it once they do. This is displayed among different menu options presented in the program and I did list some of them at the very beginning of this article.
Here is what a typical Google analytics menu looks like:
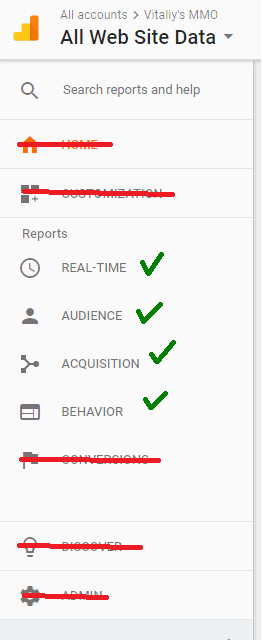
Now I did say I will not go into every single little detail, only the MAIN things I look at and it is represented in the left image via the green check marks.
These are:
Real time. This section displays if there are any people visiting your page at the present time and where they are coming from (Mobile/computer devices). This isn’t a big deal but I look at this info from time to time to see if there’s activity going on at a particular time.
Audience. This is one of the most important sections of the menu as it will give you stats on daily visitor counts (traffic coming to your site). I look at this almost every single day.
Acquisition. This section will display WHERE your audience is coming from. It is usually broken down into things like “organic traffic”, “referral traffic”, “direct traffic” and other sources.
For me personally, organic traffic is the most important form so when I look at acquisition and see a majority of my visitors are coming to me via organic means (Google, Bing and Yahoo searches), it shows me that I am doing the right thing.
Behavior. This final section shows me WHERE the audience goes to ON my website once they get there.
- Do they visit one particular page or another?
- Do they stay on just one area?
- Do they leave the site too quickly or stay on it long?
This section will help me answer that question. For this tutorial, I will focus on those 4 things because frankly, they are the most important and they give me a clear picture of how I am doing…
1) Let’s start with the real time menu:
When I open up Google analytics, the first thing I look at is the real time menu. Here is a screenshot and I have omitted the unnecessary things on this page to avoid seeing because it can confuse you. All I look at is if there are any present visitors and where they are going so the green rectangles represent that:
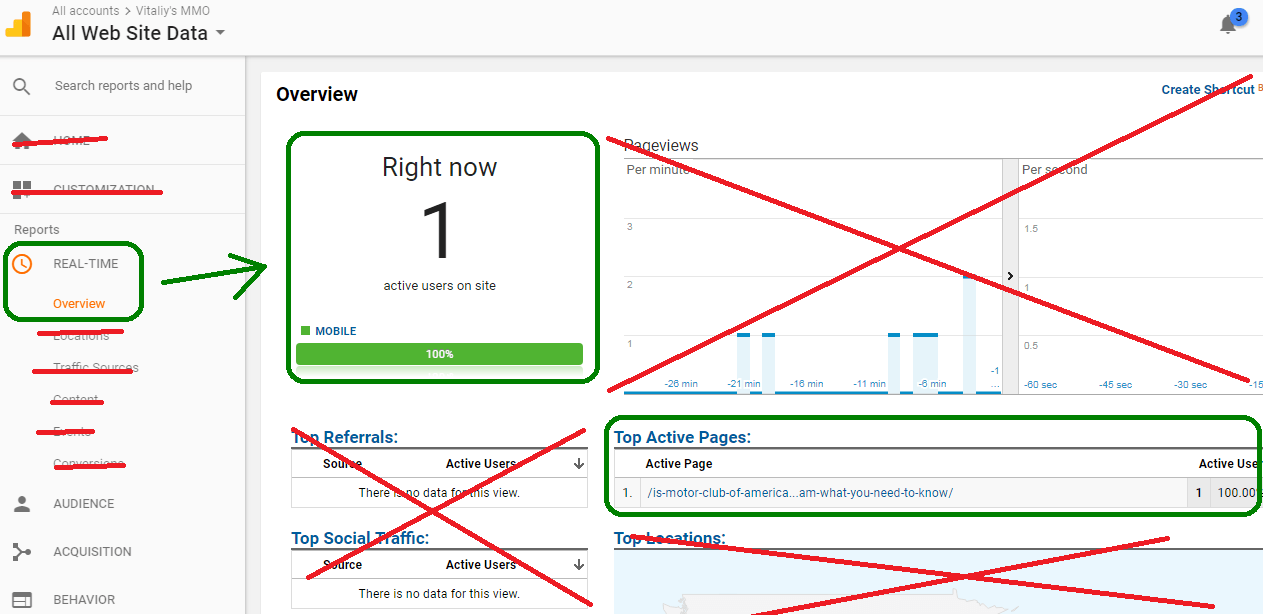
This is a very simple piece of the program and it’s easy to gauge what’s going on presently on your site. By looking at the above screenshot, I now know there is at least 1 person on the page and WHICH page they are on.
Note: When I click “Real Time”, I am also presented with other sub menus (you can see it on the left with red lines marked. I only look at “Overview” because it is the simplest thing.
2) Next is the Audience section.
As I said this is a very important part of the program. It’ll tell you how many people visit your site hourly and daily. I mostly set it to show me stats DAILY. Here is a screenshot:
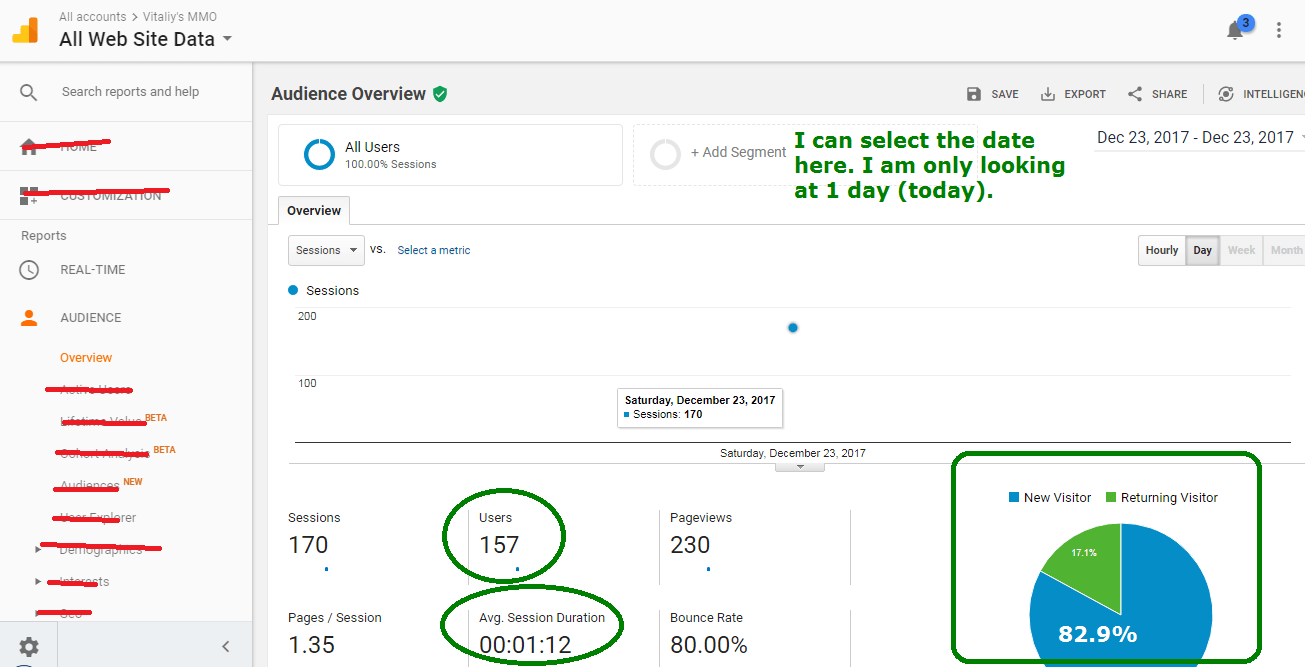
Within the audience section, just like with real time, I selected “Overview” and ignore the other sub menus. I just want a basic picture of what’s going on and this part of Google analytics is great for that.
In the following case, I have outlined (with green circles and rectangle the most important parts as well).
Today (Dec 23, 2017), I received 170 visits, however, the important number is the “users” which is 157. You see the 170 number counts people who leave and revisit my page and for informational purposes, I do not count those, only unique visits, which there are 157 of.
Additionally, under that there is a section that says “Avg session duration” and it is listed as 1 minute and 12 seconds, which means typically, people stay on my page/s for over a minute and that is a GREAT number.
And finally, I look at the pie chart to the right which shows me how many returning visitors came to my page vs new ones. Ideally for a website to be more and more profitable/successful, it does need fresh, NEW traffic to come in and in this case, I have it.
How I look at this section in general:
First I will look at how many people (traffic) have visited my website on a single day (like you saw above). Then I will expand that info across a week, month or even a year to see what the average daily traffic is like. The goal is to see how my website is doing. Is the traffic stagnant? Is it rising? Is it falling? This part of the program will show me that.
For example, let’s see how my website did for 2 years (I’ll explain why I didn’t put in 1 year). All I have to do is change the dates and examine the exact same info I showed you above:
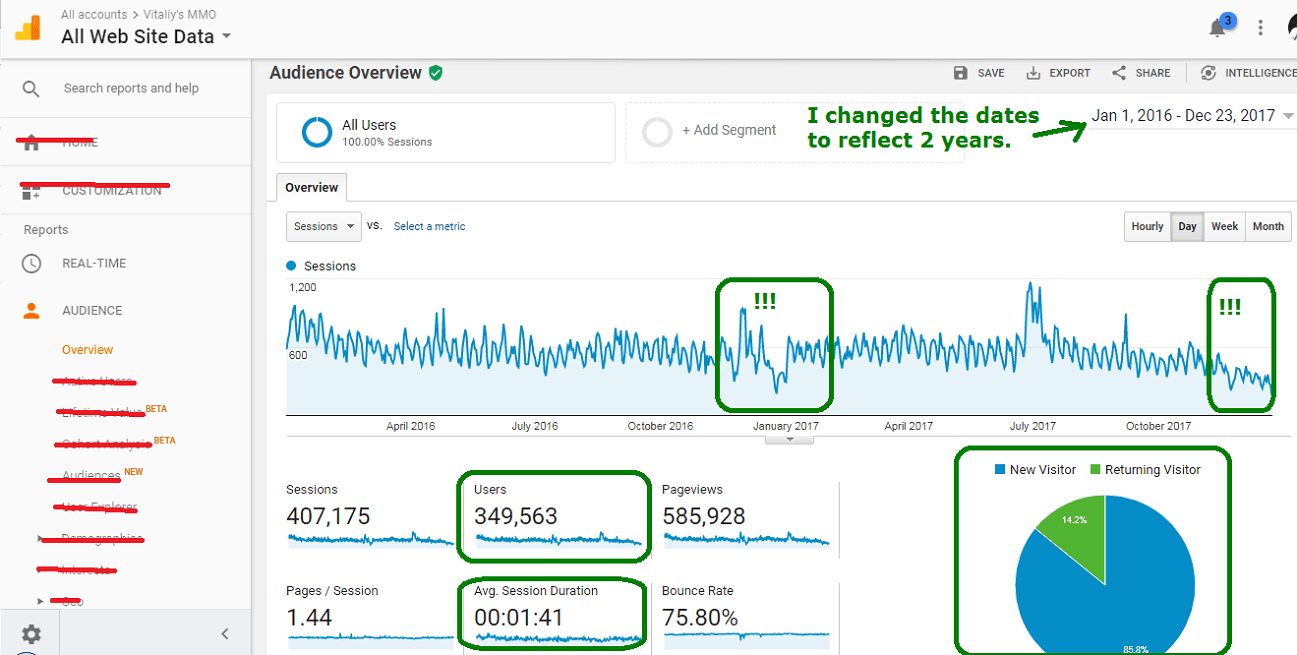
Alright, so here’s the info I got from the following data (use this analogy for your site):
The total number of users (the real unique traffic) is nearly 350,000! Wow.

Average time is 1:41, which is great!
I have over 80% of ALL traffic being NEW visitors, another great sign.
But there is something that worries me…
Notice the 2 green boxes with exclamation points I put in the chart…
There is a dramatic decrease in traffic as the year comes to a close. And it’s happening 2 years in a row. What is happening here is that the holiday season is coming up and generally my audience doesn’t search for content on Google and Bing as often, so naturally my stats start to take a tumble during this time of year.
This is the reason I put in 2 years and not 1. Had I put in 1 year and saw this downturn, I would panic and would think that my site was failing, but a 2 year look indicates this is normal and happens at the end of each year.
When you look at stats like I do, look at TRENDS. In this case, there are 2 major trends:
1) Holiday season = less traffic for me, but it picks up post January.
2) I also see a spike mid year, for both years.
Again, I am explaining all of this to show you how I understand the data points.
One more important point: This section shows you whether people visit your page through laptops or phone/tablet devices. This is important to note because if your website is NOT mobile/tablet friendly, it will suffer in rankings and your visitor’s experience. To make sure your site is MOBILE friendly, click here.
3) The acquisition part. Where are visitors coming from to my page?
This area is very important and yet simple to understand. Through it, I found out a majority of my traffic came from Google and the rest was miscellaneous sources (FB, email referral links, ect…).
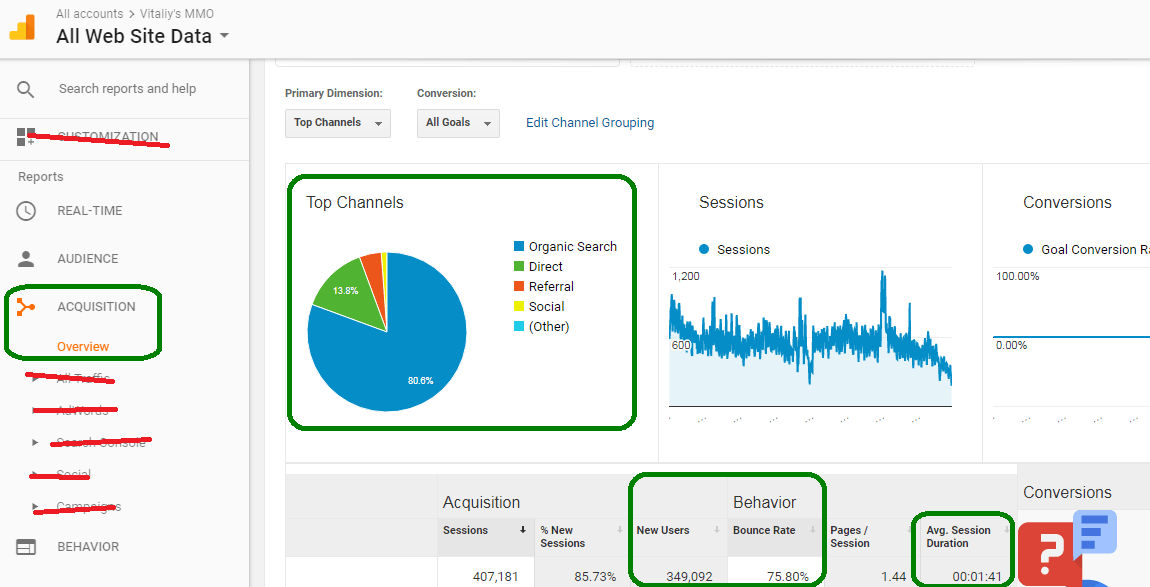
Again, I focus mainly on the pie chart, the “new users section” and “average session duration”. The last 2 pieces of info can be found above in the “audience section”, but it doesn’t hurt to have them here.
4) And finally, the behavior section…
Again, this part examines where people go to on my site in general. If I have a 100 pages, which one/s get the most visits?
For example, if I am trying to sell something, my goal would obviously be to lead ALL of my incoming traffic to that page right? And how will I know if it’s working? By using this part of Google analytics, that’s how 🙂
So let’s have a look at my 2 year data:
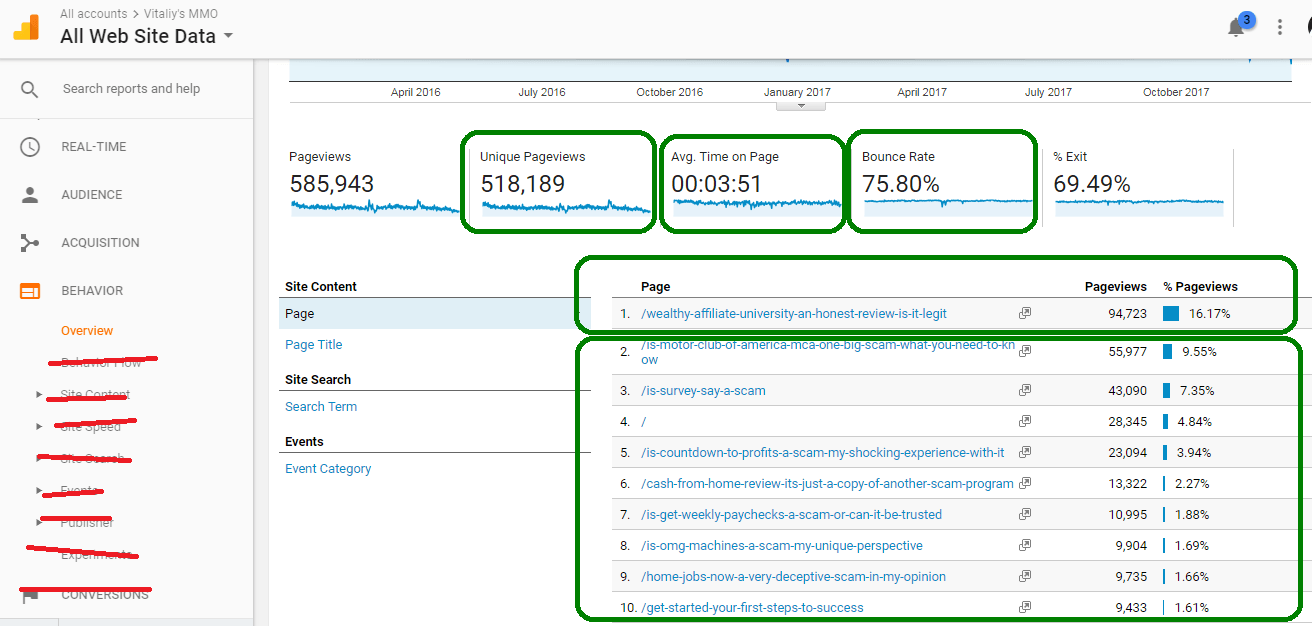
Ok, so in this final section of the tutorial, I want to again examine the places I labeled with green rectangles.
Note that in the “unique pageviews”, it lists that I have over a half a million views over the span of 2 years, but if you remember, when I looked at the stats for “Audience” above, it showed that it was 350,000.
Which is the REAL number? The answer is the 350,000.
The one listed here again, counts visits if 1 person revisits a page or the site. So while I labeled that as a green rectangle for importance, it was to show that it is not a big deal to look at this. Look at the audience for the real number of UNIQUE traffic.
Followed by that the average time on page. This is where the behavior section is HUGE. It lists it as being nearly 4 minutes! Here the big thing to look at is the list of the TOP 10 pages that get the most traffic on my site.
Then if you click on ANY of those links, you will see how long people stay on the page and that is the REAL number you need to look at.
Ok, the next thing is examining an experiment I’ve been engaged in since the start of the website…
I’ve been promoting a BIG program called Wealthy Affiliate and as I said in the beginning of this behavior section, if I am trying to sell something, the goal is to get as many people to the promotional page, so naturally, I’d want to get 100% of the traffic there. How am I doing?
Well good and bad…
Good because my #1 most visited page on the site is indeed the Wealthy Affiliate page.
But it is “bad” or not so good because it gets 16.17% of ALL incoming traffic. So the data here indicates that I can improve upon that.
How can I do that?
Well that leads me to look at the other 9 pages listed on the top 10 list above. They get a bulk of all the traffic, and they all link to my Wealthy Affiliate page. So if I took those pages and did things like provided more links to the Wealthy Affiliate page, I could potentially raise that 16.17% to higher rates. Right now, the goal is to get it to 20% and over.
Here’s some personal tips you can follow if you’re experiencing similar issues and are seeking ways to improve click through rates to your main promotional page.
Do you see how I am using the data to make adjustments to the site?
I am giving you real time examples of how I personally take data and make changes based off it. This is how you should also look at your site as well.
My final thoughts:
I have covered the basics and arguably the most important data points inside Google analytics that you should look at. Again, I am going to re-advise that you look at each point long enough to understand it, then get into the next one.
If you already have a Google analytics account installed for a website, cross reference this tutorial to your analytics account so you can see how your site is performing with visitors.
I hope this tutorial on Google analytics has been helpful to you 🙂

Found your article very useful and I like you break it down into the parts we need to focus on, was easy to follow because I struggle with Google sometimes when you use their learn more feature. I often find it beyond my understanding, which makes it harder for new people just getting in to the online business world. One of my website’s Google analytics has flat lined and I have tried a few ways to sort it out as yet nothing has worked even sent a request to Google and that was a few months back, I am still waiting for a answer. This is a great guide for beginners.
Make a new account and put in a new code to the site you said “flat lined” Katie. I think you may have changed themes or the code broke in what was perhaps an update on your site. This is my guess.
Thanks for this! I’m starting an online business and have just gotten started with google analytics, this breakdown has really helped me see where I should put my attention and where the numbers are that I need to work with. When first logging in its almost overwhelming with all the information, as someone whose new to this. How long was it before you started seeing traffic when you first started?
It depends on which scenario we’re talking about. If you mean in SEO, organically, I got rankings and traffic within a few weeks, but it was small and built up overtime. I did also do PPC at times and that in the best cases got my traffic within an hour.
I learned a lot from your page. You gave a detailed analysis about google analytics. It is interesting to know that Google gives us all these benefits the moment we have a website. To know that you can be sure of the actual number of people coming to your site really makes the blogging business worth it. Thanks for the info.
It ultimately serves Google’s best interest because it gives websites an incentive to grow and profit with this information.
Good tutorial. I wish I had read it before I started to install it in my WordPress. I will keep it bookmarked until I remember the meaning of it all. Imagine if we could get real demographic data so no sweat whether or not we will get it right when paying for ads on Facebook and elsewhere .
You can always erase the current code and install a new one Alex, it’s not a big deal 🙂
Thanks so much for posting this. I always find your writing so informative and easy to understand, I thoroughly appreciate it. I’m curious, at what point should I start looking at trends within my analytics? My blog is about a month and a half old and I am not yet seeing any “organic” traffic. Is this typical for a new blog or is this something I should be considering carefully. I am very happy with the amount of traffic I am receiving, I’m just not sure it is coming from the right places. Thanks so much for any info!
If your aim is organic traffic and you’re not seeing it, your site requires more content to be posted and more targeting of low competition keywords to happen Jennifer. But normally, a month and a half isn’t really enough time to see big organic traffic coming in, it usually hits after month 2 and explodes after month 5-6.
If you can tell me what your blog is about and how much content you’ve posted so far, I may be better able to analyze the situation and offer a more specific answer and plan of action.
Hello and thanks for your post! It was very informative!
I, too, have my own website! My favorite part of google analytics is the real time visitors window! I don’t know why it is such a thrill to see just how many people are viewing my website at that exact moment in time… it just is!
As far as the organic search results go…I notice that when I click to view what keywords people are getting to my site from, it always says that this is unavailable.
Do you experience this as well?
Yeah this is a very inconvenient thing that was removed a few years back for reasons I can’t quite understand, but your main keyword will not be listed. It’ll simply say “not specified”. But the way around that is to get yourself Google Webmaster Tools installed and THAT program will tell you which keywords you’re ranking for :). I believe I linked to a post on how to install that above.
Hey Vitaliy,
I just wanted to take a moment to say, terrific job on this article. The information is useful and easy to pick up, whether you’ve been doing this a little while, or you’re brand new. Having a working knowledge of Google Analytics, webmaster tools, and SEO, would have made my life a lot easier when I built my first website. I am also very thankful for the Wealthy Affiliate community, and when I see people promoting it, I get a sense of pride. Because it is just that, a community of people helping people succeed. Great article man, it’s obvious that you have been putting in the work! Keep it up, I will definitely be checking back for more tips!
In health,
-Ian
No problem Ian! I hope this article and WA have helped you grow your website 🙂
That is a really helpful guide for beginners. You clearly explained the importance of have a such important tool. With it we can really get a real insight of how a website is performing.
So with small tweaks you can get more or less the desired featured. The tabs you showed in this post is what I personally use daily. Although I know there are more that can be done with that tool.
Segmentation, tracking visitors activity and much more.
Oh absolutely, there is a ton more you can do with analytics, but for me personally, with a niche website, a lot of those extra options are distracting. For example, I don’t really need to know much about my demographics since I attract the correct niche audience to the site. In that situation, the right audience finds me and that basically overshadows the need to worry about the demographics, unless I am just curious to find out who a majority of my incoming visitors are.